The Regional LSAC Pool and Excess Whiteness
 The LSAC applicant pool included 10 LSAC regions. Regional whiteness was calculated by adding the total applications for the states in the region; the total white applicants for the states in the region; and dividing total white applicants by total applicants. The table identifies the Whiteness in the regional applicant pool. Excess Whiteness for a school is calculated by subtracting the percentage of white students in the first-year enrollment for 2017 through 2019 from the percentage of white students in the regional applicant pool. The Midwest had the Whitest applicant pool (84%) and the Far West had the least White applicant pool (40%).
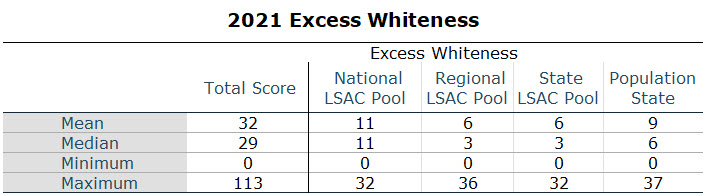
Of the 200 law schools in this report, 119 (59.5%) had more White students in their first-year class than in their regional LSAC application pool. Of the 119 law schools with Excess Whiteness, the minimum number of Excess Whiteness points was 1. The maximum number of Excess Whiteness points was 36. The mean (average) number of Excess Whiteness points was 6.6. Half the schools had fewer than 2.5 Excess Whiteness points.
| Region Name | States in Region | Whiteness in Applicant Pool |
| Far West | Alaska, California, Hawaii, Nevada | 41% |
| Great Lakes | Illinois, Indiana, Michigan, Minnesota, Ohio, Wisconsin | 76% |
| Midsouth | Delaware, District of Columbia, Kentucky, Maryland, North Carolina, Tennessee, Virginia, West Virginia | 70% |
| Midwest | Iowa, Kansas, Missouri, Nebraska, North Dakota, South Dakota | 84% |
| Mountain West | Arizona, Colorado, Idaho, Montana, New Mexico, Utah, Wyoming | 76% |
| New England | Connecticut, Maine, Massachusetts, New Hampshire, Rhode Island, Vermont | 77% |
| Northeast | New Jersey, New York, Pennsylvania | 66% |
| Northwest | Oregon, Washington | 73% |
| South Central | Arkansas, Louisiana, Oklahoma, Texas | 58% |
| Southeast | Alabama, Florida, Georgia, Mississippi, South Carolina, Puerto Rico | 50% |
Correlations
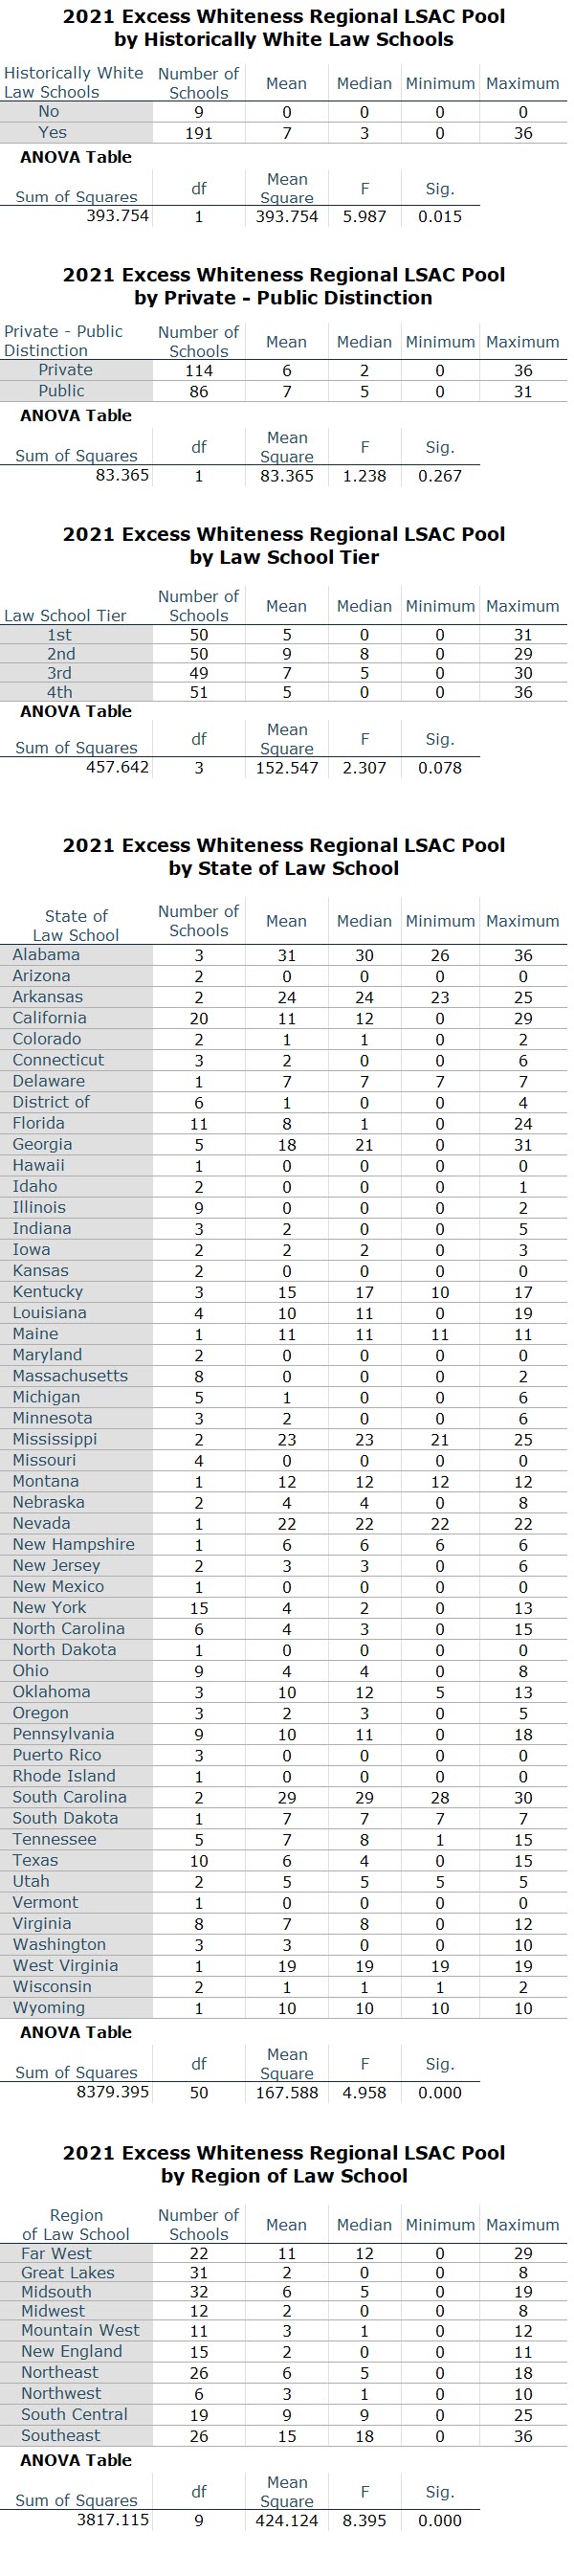
- Historically White Law Schools. All the schools with Excess Whiteness were historically White law schools (p=.015).
- Public vs. Private. Private schools had a lower mean difference in Excess Whiteness points (6) than public law schools (7); however, this difference is not statistically significant (p=.267).
- Tier. There was a difference in mean points based on tier; with second- and fourth-tier law schools having the lowest mean (5 points) and second-tier law schools having the highest (9). The difference, however, was not statistically significant (p=.075).
- States. There was a difference in mean among states. Alabama had the highest mean difference (30.6), and Minnesota had the lowest (.283). Several states' schools had no Excess Whiteness The schools in the states of Arizona, Hawaii, Kansas, New Mexico, Rhode Island and Vermont and Puerto Rico had no Excess Whiteness. The difference was statistically significant (p=.000).
- Regions. There was a difference in mean among regions; the Southeast had the highest mean difference (22.8), and the Great Lakes had the lowest (3.8). The difference was statistically significant (p=.000)
Charts and Tables
 |
Regional LSAC Applicant Database
This database includes all 200 schools. It can be sorted by columns and searched. Click on a row for additional information.
Legend: TWLS The Whitest Law School; EW Excess Whiteness; TW Total Whiteness; FY First Year; LSAC Law School Admission Council; Pop Population.